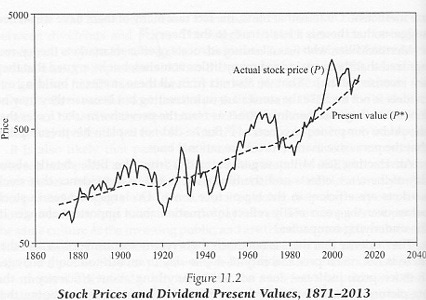
The Most Convincing Figure in Irrational Exuberance
I never got around to reading the previous editions of Robert Shiller’s Irrational Exurberance, but I’ve finished reading the new third edition cover-to-cover.

Rather than review the whole book, consider the single most convincing figure. At first glance, it’s easy to miss the point.

Shiller begins with an obvious observation: “The dividend value is extremely steady and trend-like, partly because the calculations for present value use data over a range far into the future and partly because dividends have not moved very dramatically.”
So what? Here’s what:
[S]tock prices appear too volatile to be considered in accord with efficient markets. Assuming that stock prices are supposed to be an optimal predictor of the dividend present value, then they should not jump around erratically if the true fundamental value is growing along a smooth trend.
The next three sentences are truly profound:
Only if the public could predict the future perfectly should the price be as volatile as the present value, and in that case it should match up perfectly with the present value. If the public cannot predict well, then the forecast should move around a lot less than the present value. But that’s not what we see in Figure 11.2. [emphasis mine]
By analogy, suppose you graphed actual temperature against predicted temperature. Which should be more volatile? Actual temperature, of course. Predicted temperature should be heavily based on long-run average temperatures, which don’t jump around much. (Indeed, if you look more than ten days into the future, weather sites often just report historic means, putting zero weight on current weather). Actual temperatures, however, are routinely surprising.
Now ask yourself: In Shiller’s figure, which line is analogous to actual temperature? Actual present values of dividends, of course. Then which line is analogous to predicted temperature? Observed stock prices – the market’s best guess of the present value of dividends. Yet contrary to the basic logic of forecasting, the latter is jumpy even though the former is steady.
This is a classic case of, “If you’re not confused, you don’t understand what’s going on.” Shiller’s attempts to resolve these puzzles leave me dissatisfied, but kudos to him for opening my eyes to the enormity of the oddity.
The post appeared first on Econlib.

