How Open Borders Died in Five Countries
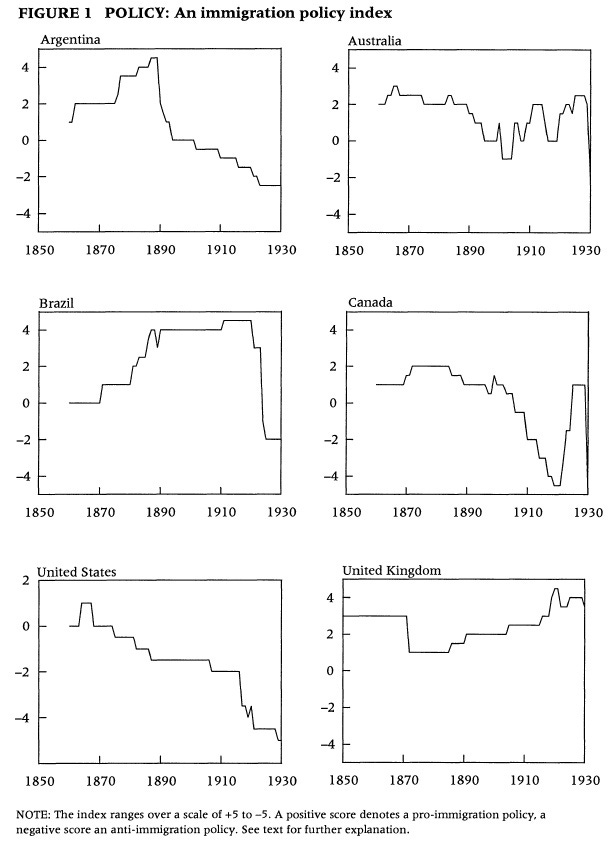
During the last half of the 19th century , many countries competed to attract immigrants. All of them eventually reversed course, but how exactly did this reversal unfold? In “Immigration Policy Prior to the 1930s” (Population and Development Review, 1998), Ashley Timmer and Jeffrey Williamson show what happened to immigration policy in the U.S., Canada, Argentina, Brazil, Australia, and the United Kingdom from 1860 to 1930.
Timmer and Williamson begin by proposing a policy coding system. Quick version, “The index ranges over a scale of +5 to -5. A positive score denotes a pro-immigration policy, possibly including comprehensive subsidies for passage and for support upon arrival. A negative score denotes anti-immigration policy, possibly including quotas, literacy tests, and legal discriminatory treatment after arrival. A zero denotes policy neutrality, or a neutral outcome between conflicting pro- and anti-immigration policies.” Detailed version:
5 Active worker recruitment abroad with advertising and labor offices, free land or subsidized land purchase, subsidized or assisted passage, temporary lodging, free transport inland from port of arrival, easy naturalization, legal property ownership.
4 Free or subsidized land, immigration treaties or contracts with shipping companies, lodging, worker recruitment, easy naturalization, legal property ownership.
3 Overseas immigration offices, debarkation coordination, land designated for settlement, easy naturalization, legal property ownership.
2 Overseas immigration offices, debarkation coordination, easy naturalization, legal property ownership.
1 Modest advertising, easy naturalization, legal property ownership.
0 Open doors, no encouragement, no discouragement. Or, a balance of pro-immigration and anti-immigrant policies.
-1 Regulations on shipping companies and/or contracts for assisted pas- sage.
-2 Class restrictions on immigration (no paupers, potential wards of the state, criminals) or selective source-country bans (e.g., no Asians).
-3 The above restrictions plus laws for registration, deportation provisions, laws restricting property ownership, unenforced selectivity laws (such as literacy tests).
-4 Restrictive quotas, enforced literacy tests, or other measures designed to reduce immigration volume significantly.
-5 Closed (or only slightly ajar) doors, enforced.
What about countries that combined both pro- and anti-immigration measures?
Whenever we found a mix of pro-immigration and anti-immigration policies, we simply added up the positive and negative attributes to get an overall score. Since a source-country ban on immigration was generally scored -2, and subsidy and recruitment programs were generally scored +3, Canada received a net score of + 1 around the turn of the century. Similarly, in the early twentieth century, Australia recruited and subsidized immigration but also required a dictation test on demand, and we scored this mix a 0 for several years. Because of the mix of policies, we allowed half-steps in the scoring.
Here’s what they find:
Notice: Back when the United States allowed free immigration, other governments actively encouraged it! Indeed, the U.S. looks like the least pro-immigrant country of the bunch. Canada tried a little harder to attract immigrants, Australia, Argentina, and especially Brazil once tried mightily to recruit them, and the U.K. continued to actively promote immigration until at least 1930.
The major drawback with the Timmer-Williamson scores: Since it is based purely on qualitative policy features, it glosses over massive quantitative policy developments. Most obviously, America’s landmark 1924 Immigration Act is invisible in the data. Why? Because the U.S. had already adopted milder quotas in 1921. Indeed, the Timmer-Williamson system would apparently continue to code the U.S. at -5, even after the remarkable liberalization under the 1965 Immigration Act.
But let us not neglect Timmer-Williamson’ great innovation: Revealing the diversity of immigration policy during the “open borders era.” The United States initially opted for laissez-faire, then slowly rolled down the slippery slope of restrictionism. The U.K. aside, the other countries saw larger policy swings. Indeed, most did a full about-face on immigration, switching from active government support to active government opposition. I’ve been studying this issue for decades, and this is still news to me.
Question: Timmer and Williamson provide a nation-by-nation account of their coding in Appendix C of this paper. If you know the history of Argentina, Australia, Brazil, Canada, or the U.K. well, how would you grade their approach?
The post appeared first on Econlib.


Can't read the paper, but it seems perfectly logical that Brazil would be the country that tried hardest of those six. During the last decades of the 19th century Brazil was by far the poorest - Argentina was three to four times richer.
And Brazil's aggressive promotion of immigration worked. Nowadays, Brazil's per capita income is much higher as a fraction of those countries' income (*) than what it was a century and a half ago.
It does seem a bit odd that the graph (Figure 1) implies anti-immigration policies during 1920s Brazil though, at a time when Japanese migration to the country was highest.
(*) Maybe with the exception of Canada.
In peril of sounding hopelessly nerdy here but the diverse range of immigration policies is familiar to aficionados of 19th century grand strategy games like Victoria. Playing as a country in America, especially in South America, part of the standard optimal game plan is to enact policies that will boost immigration to achieve the population base to leapfrog the US and launch your nation into great power status by the late industrial age. There are guides and walkthroughs about how to maximize your immigration and everything.