Ancestry and Long-Run Growth Reading Club: Comin, Easterly, and Gong
Welcome to the second installment of the EconLog Reading Club on Ancestry and Long-Run Growth. This week’s paper: Comin, Diego, William Easterly, and Erick Gong. 2010. “Was the Wealth of Nations Determined in 1000 BC?” American Economic Journal: Macroeconomics 2 (3): 65-97. The authors’ data is here.
Summary
We’ve already seen what happens if we try to predict nations’ current economic conditions using measures of early political organization and agriculture. As long as we measure nationality by ancestry rather than location, historical precocity predicts modern prosperity. What happens if we measure early technology in the same way? Comin, Easterly, and Gong construct a data set on societies’ technologies in 1000 BC, 0 AD, and 1500 AD. Measured by location, these technology measures are mildly predictive. Measured by ancestry – using Putterman-Weil’s migration matrix – these technology measures are highly predictive.
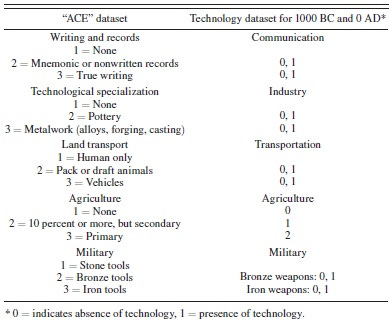
What historic technologies do CEG consider? For 1000 BC and 0 AD, the basics:
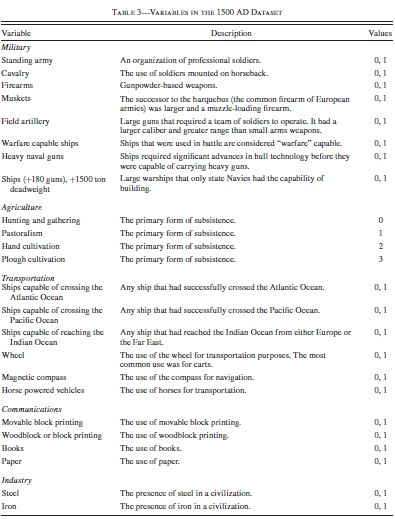
For 1500 AD, measured techs are far more advanced.
Finally, here is how CEG measure current technology.
This measure captures (one minus) the average gap in the intensity of adoption of ten major current technologies with respect to the United States. These technologies are electricity (in 1990), Internet (in 1996), PCs (in 2002), cell phones (in 2002), telephones (in 1970), cargo and passenger aviation (in 1990), trucks (in 1990), cars (in 1990), and tractors (in 1970) all in per capita terms.
More specifically, for each technology, Comin, Hobijn, and Rovito (2008) measure how many years ago the United States last had the usage of technology “x” that country “c” currently has. We take these estimates and normalize them by the number of years since the invention of the technology to make them comparable across technologies, take the average across technologies and multiply the average lag by minus one and add one to obtain a measure of the average gap in the intensity of adoption with respect to the United States, whose adoption level is one, by construction.
What are the basic facts of technological development over time? Here’s a fun table.
In 1000 BC, China and the Arab world were the pinnacle of civilization; Western Europe and India lagged well behind. By 0 AD, all four were almost maxed out. By 1500 AD, Western Europe took the lead, with China close behind. Today, Western Europe dominates (though it’s still way behind the United States), followed by the Arab world, with China and India at the bottom. Despite these contrarian findings, CEG find it necessary to remark:
Why do our historical rankings differ from the view that ancient Europeans were barbarians, while China and the Middle East/Islamic civilizations were well in the lead for most of our sample period and produced most of the useful inventions? Basically, it is because what we are measuring is the adoption of technologies rather than the invention…
As long as “ancient” means “1000 BC,” though, CEG confirm the “ancient European barbarians” stereotype.
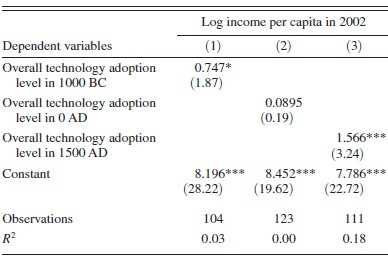
After several intervening sections, CEG estimate the effect of historical technology on modern conditions. Unadjusted for migration, the results are only mildly impressive.
Effect sizes are big for 1000 BC and 1500 AD, but not for 0 AD. The statistical significance for 1000 BC, however, is frail. And this is before adding a single control variable.
Adjusting for ancestry, however, dramatically pumps up the estimates. How do CEG do this? By following the yellow brick road laid out in last week’s paper, where Putterman and Weil remarked:
The [ancestry] matrix can be used as a tool to adjust historical data to reflect the status in the year 1500 of the ancestors of a country’s current population. That is, we can convert any measure applicable to countries into a measure applicable to the ancestors of the people who now live in each country.
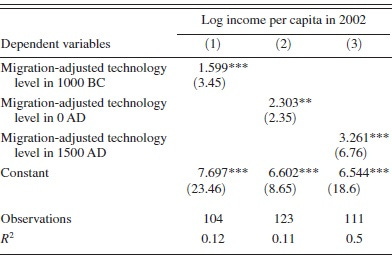
Here’s what CEG find in the Emerald City:
Takeaway: “Our key 1500 AD result implies large magnitudes. Regressing income today on the migration-weighted index for 1500 AD, a coefficient of 3.261 implies that a movement from 0 to 1 is associated with an increase in per capita income today by a factor of 26.1. The log difference in per capita income today between Western Europe and sub-Saharan Africa is 2.59 (a factor of 13.3). This income difference is usually attributed to the post-1500 slave trade, colonialism, and post-independence factors in sub-Saharan Africa.”
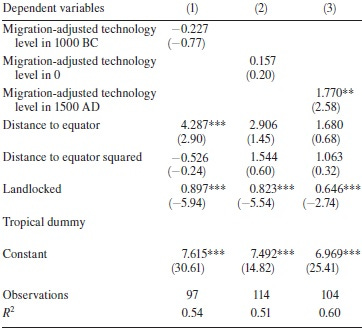
CEG handily show that in a horse-race, ancestry-adjusted measures of technology crush location-based measures. But how do the results for log per-capita income hold up in the face of well-established geographic controls?
Overall, pretty poorly. Adjusting for ancestry, adding standard geographic controls reverses the sign of technology in 1000 BC, leaves a barely statistically significant effect of technology in 0 AD, and reduces the coefficient on 1500 AD tech by almost 50%. Since we’re predicting log income, that’s an even bigger downward revision than it looks. Moving from 0 to 1 now yields a increase of 590%, not 2,610%. (By the way, if you’re puzzled by the benefits of being landlocked, so was I. When I checked with Easterly, he confirmed those positive landlocked coefficients are typos; all should be negative). Note further that the lack of statistical significance on distance from the equator probably stems from the inclusion of a linear and squared term; if CEG stuck with a linear specification like Putterman and Weil, absolute latitude would have its usual clear-cut payoff.
CEG wrap up the paper with further robustness tests. As far as I can tell, they don’t explicitly answer the question, “Was the Wealth of Nations Determined in 1000 BC?” But their data say No.
Critical Comments
1. This is another very impressive paper. While there’s plenty to debate in the history of technology, CEG make a serious effort to code the basic facts. If I re-did their work, I’d expect a correlation of at least .8 between their measures and mine. And it’s great to see CEG extend PW’s ancestry matrix to a new and plausibly important variable.
2. A careful reading shows that CEG is widely misread. They don’t show that events thousands of years ago matter today – even adjusting for ancestry! After adding standard controls, tech in 1000 BC doesn’t matter. Neither does tech in 0 AD. Tech in 1500 AD definitely seems important. But since only one out of three measures of tech works as expected, the wise interpretation is unclear.
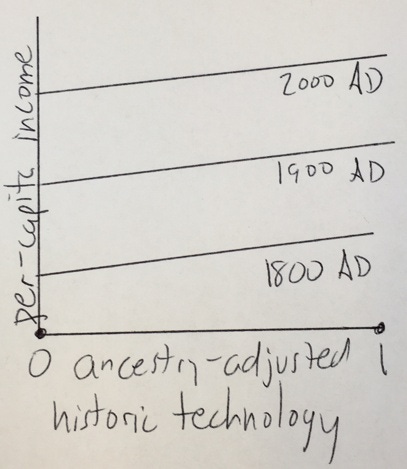
3. Suppose CEG found a much larger effect of tech in 1000 BC. Would this really show “the wealth of nations was determined in 1000 BC”? Only if you interpret the wealth of nations in relative terms: the most advanced countries in the past are the richest countries in the present. This emphatically does not mean, however, that countries that were technologically backward in 1000 BC are doomed to absolutely poor today. Worldwide economic growth over the last two centuries means that holding the past fixed, the present is dramatically improving. Graphically:
Does this graph show per-capita income is “determined by historic technology”? At any point in time, yes. But the overall function is still dramatically shifting up over time. My point: Contrary to some, CEG provide no support for fatalism. Frankly, they should have tried harder to prevent that misreading.
4. Does CEG show low-skilled immigration is bad? No more than Putterman-Weil did. In both cases, you need to remember all the results. Yes, countries inhabited the descendants of more advanced civilizations do better – and you can’t change your ancestors. But CEG, like PW, also detect enormous long-run benefits of geography. And you can effectively change geography by letting people to move to the parts of the globe most hospitable to prosperity. Contrary to popular opinion, this is not a great “national sacrifice.” Since migration dramatically increases productivity, migrants enrich themselves by enriching their customers – starting with their new neighbors.
5. While CEG’s results are interesting and important, they’re noticeably weaker than PW’s. In a three-way race between State History, Agriculture, and Technology – Garett Jones’ “SAT score” – State History and Agriculture are roughly on par, but Technology lags behind. Why isn’t anyone doing a standard econometric horse race with all three explanatory variables in the same regression? My best guess is that they’re too correlated to disentangle. If I learn more, I’ll post it here.
The post appeared first on Econlib.



You can tell the coefficients on Landlocked are typos because the given t stats are negative
"doomed to absolutely poor today." Maybe the missing "be" got left on Econlib. I kind of hope so.